SitScape Releases 3.1.8 is ready today!
It is our great pleasure to announce that SitScape’s latest software release of version of 3.1.8 is available today!
Continuing our rapid pace of innovation as well as quality control, release 3.1.8 is our latest upgrade with some significant improvements and breakthrough features.
Some quick highlights in this release are:
- 1-Click Dashboard: With just 1-click to create an amazing dashboard containing multiple correlated charts from any data table/source – now anyone can create a beautiful data-driven and interactive, and correlated dashboard in 5 seconds !
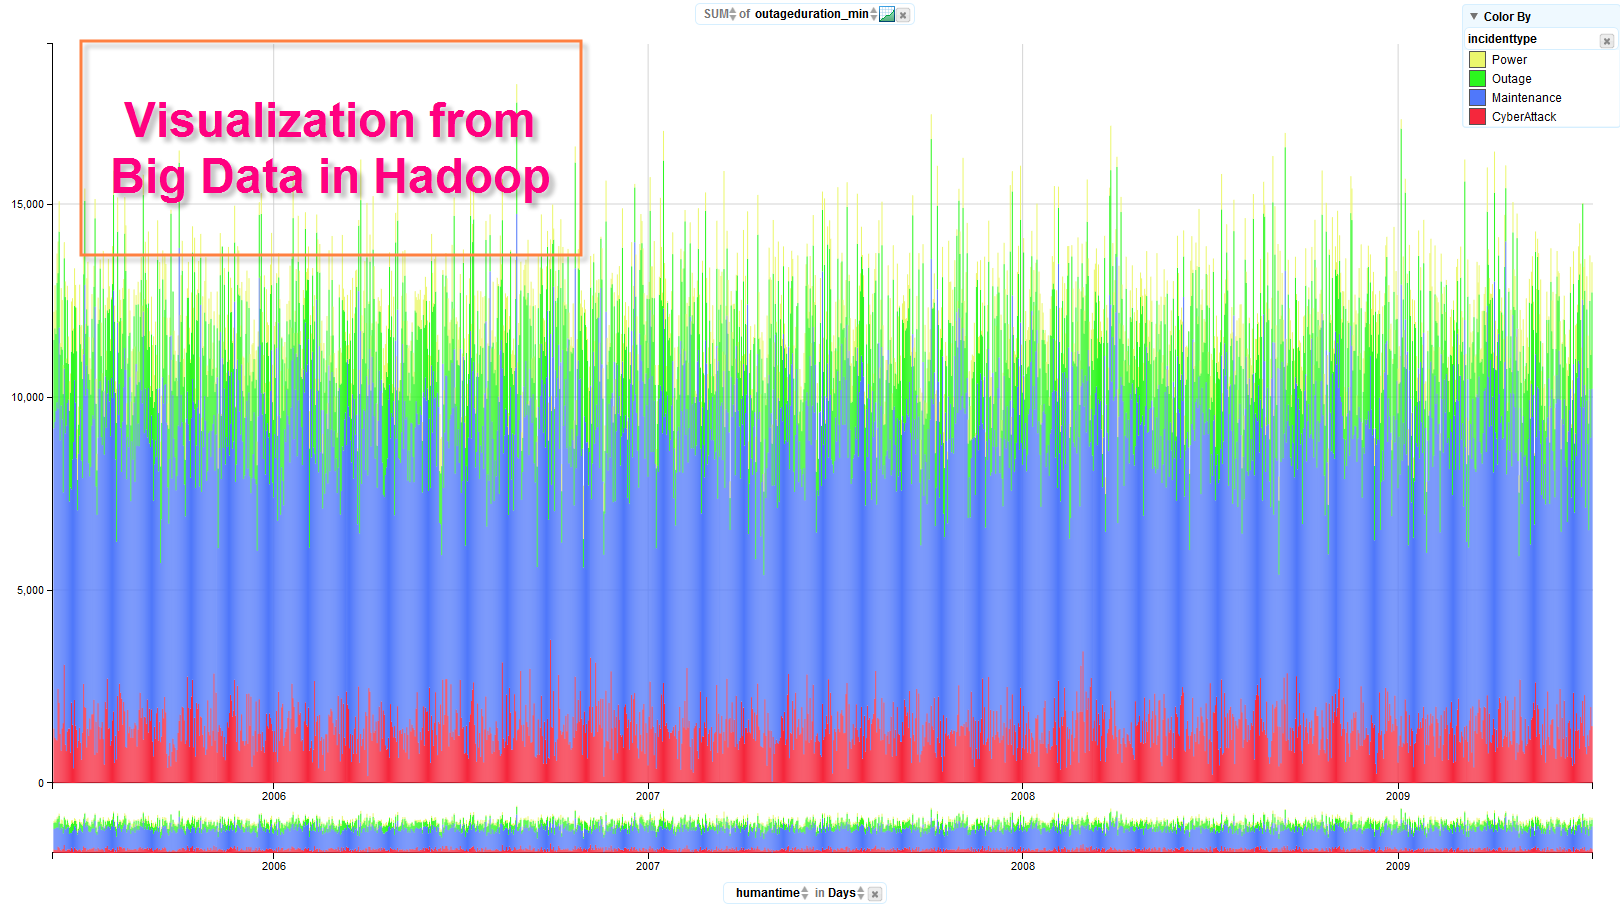
- Big-Data Visualization and Correlation : Support near-real-time interactive data visualization, data discovery and data correlation from big Data Stores such as Hadoop using Impala, right in your web browser
- Motion Chart and Animation: Support of Scatter and Bubble Chart with Motion Animation over any timeline or dimension.
- Visual Data Blending: Just Drag-and-Drop of charts from disparate data sources and visually blend them in a single chart or visualization on-the-fly – all done in less than 3 seconds! This is no matter where those underlying actual data are physically stored or in what format, could be in RDBMS, Hadoop, JSON feed, XML, CSV or Excel etc.
- Pivot Charts Enhancements: now support various advanced color-by, and size-by, multiple measures, all with amazing slice-and-dice interactions.
- Report Exporting and Scheduling: Easily exporting any on-screen Object (such as a Chart or Map), any UDOP Dashboard Page into a PDF or an Images, and can support advanced scheduling and targeted delivery of those Reports and Charts via email.
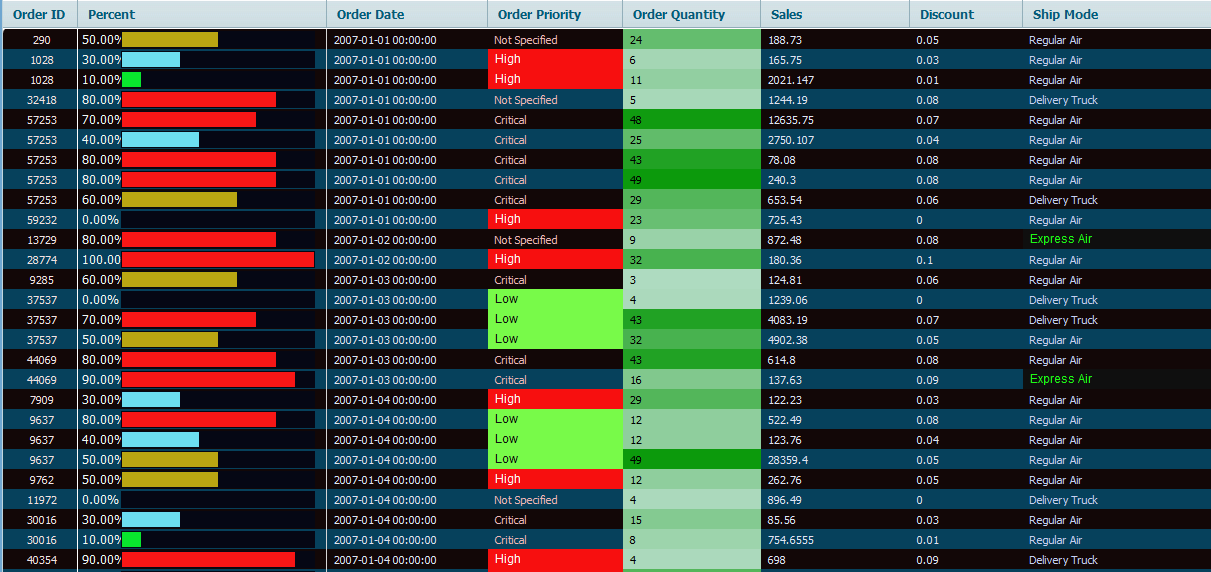
- Data Grid Advanced Styling: Very flexible and powerful visual styling of data grid
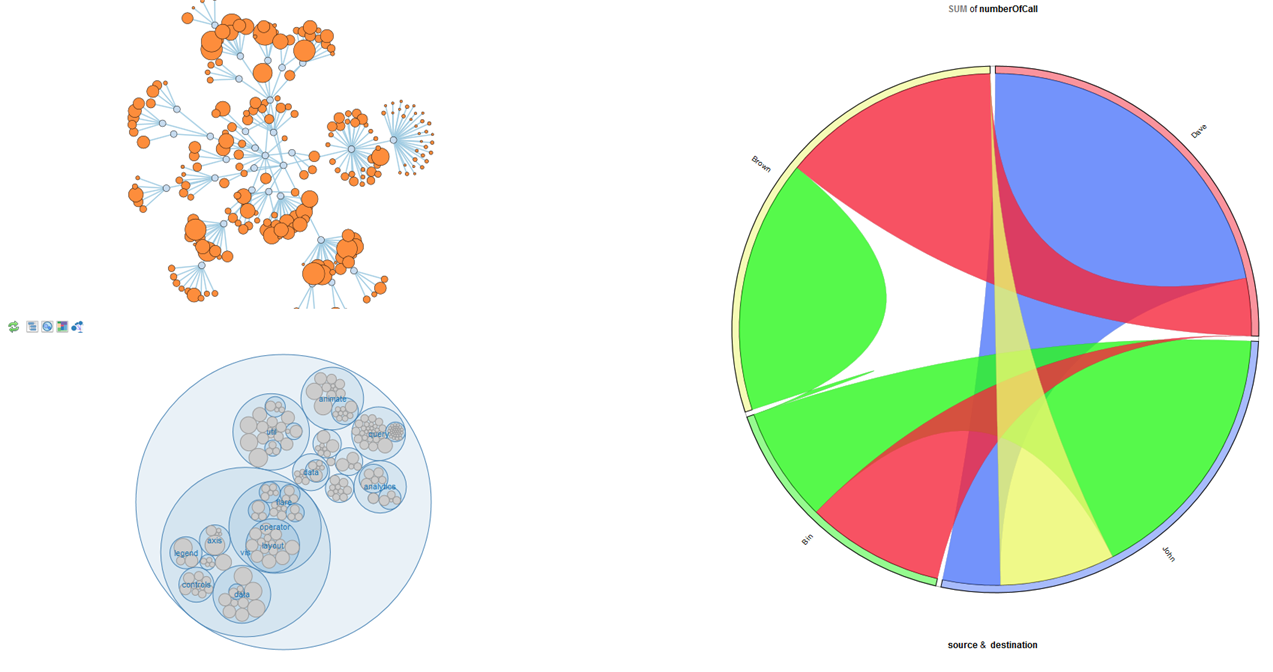
- Advanced Charting Enhancements: Various enhancements in TimeLine Chart, HeatGrid, TreeMap Chart and a Link Graph etc.
- Enhanced JSON support
- Logical Data Sources: support Logical Data Source Definition, sharing and security control
- Bookmark : Support bookmarking of any Object such as a Chart, a Video Feed, a document, a JSON feed, a RSS feed, a remote desktop etc. or any UDOP Page or Bundle with one-click.
- Remote Desktop as an object in UDOP page: Support remote desktop access to any remote PC or server right in your browser in your UDOP Page, so you can combine data analytic with real-time operational support and actions.
A number of our large government and Fortune 100 customers are now deploying this latest release. We appreciate your business and your feedback to our previous releases!


